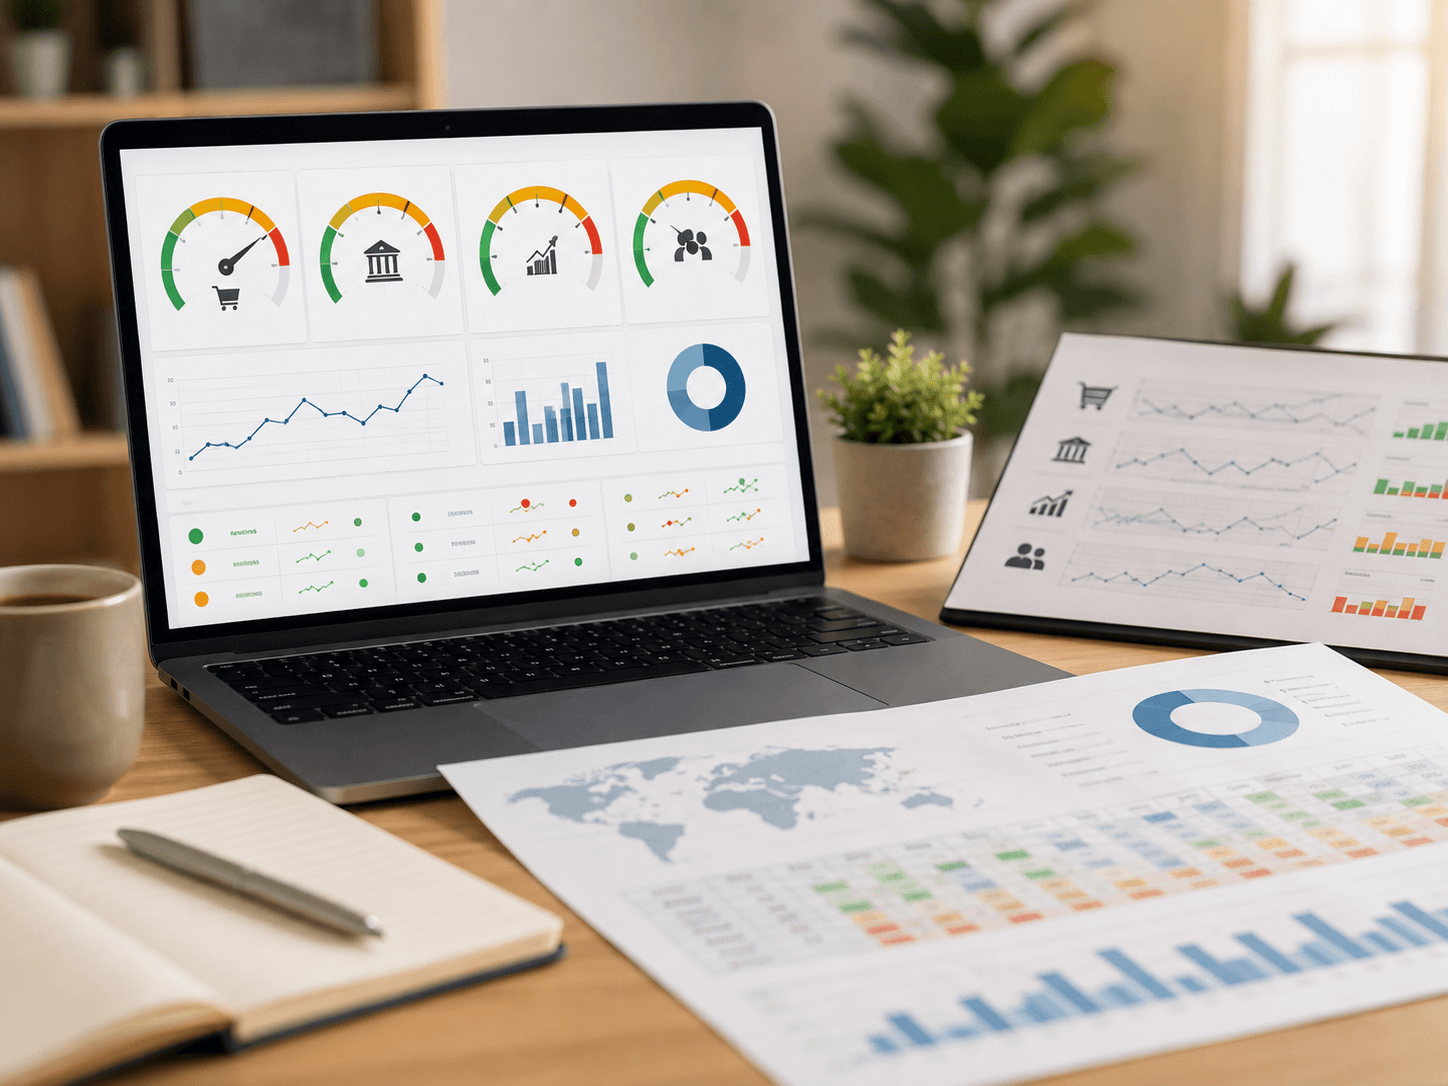
Imagine sliding into the driver’s seat of a car with no dashboard. The engine hums, the road twists and curves, but you have no idea how fast you’re going, how much fuel is in the tank, or whether the engine is about to overheat. That’s what it feels like to invest without paying attention to key indicators. The market may move, but without gauges, you’re steering blind—relying on instinct instead of strategic information. A proper dashboard doesn’t guarantee a perfect ride, but it gives you the visibility you need to make smarter, safer decisions.
One of the most-watched gauges is the price-to-earnings ratio (P/E), often called the market’s speedometer. It’s calculated by dividing a company’s stock price by its earnings per share (EPS). A higher P/E means investors are paying more for each dollar of earnings, often because they expect future growth. That can be a sign of optimism, but it also carries risk if expectations aren’t met. A lower P/E might point to undervaluation or slower growth prospects. On its own, P/E is a snapshot, which is why investors also look at market capitalization [the total value of a company’s outstanding shares (price per share × number of shares)]. Market cap determines whether a company is considered small-cap, mid-cap, or large-cap, each category signifies different levels of risk and growth potential.
Fuel matters too, and in investing that’s often measured through the dividend yield. This is the annual dividend per share divided by the stock price, giving you the percentage return in cash payouts. A company paying $2 in dividends on a $50 stock has a 4% yield—steady income that can cushion against market downturns. But dividends don’t have to be the only source of fuel. Many companies reinvest profits to grow instead of paying shareholders directly. That’s where free cash flow comes in, the cash left after operating expenses and capital expenditures are paid. Unlike earnings, which can be manipulated by accounting choices, free cash flow is harder to manipulate. It shows whether a company has real financial flexibility to expand, repay debt, or return value to shareholders.
Another key indicator is volatility, a measure of how much a stock’s price swings compared to the overall market. Investors often check “beta,” which compares a stock’s volatility to the S&P 500. A beta above 1 means the stock is more volatile than the market; below 1 means it’s steadier. On a market-wide level, traders watch the VIX, sometimes called the “fear index,” which reflects expected volatility in the coming month. Alongside volatility, earnings growth serves as a longer-term odometer. Measured by comparing current earnings to past earnings, often year-over-year or quarter-over-quarter, it signals whether a company is actually increasing profitability. Consistent earnings growth shows durability; stagnant or shrinking earnings raise questions about long-term potential.
Finally, there’s the debt-to-equity ratio, the classic check-engine light. It’s calculated by dividing a company’s total liabilities by shareholders’ equity. A ratio above 2.0 may suggest the company is heavily reliant on borrowed money, which amplifies both risk and potential returns. In stable industries, some debt is manageable, even efficient. But excessive leverage means the company’s future depends on its ability to refinance or sustain cash flow, leaving little room for error.
Together, these indicators (P/E ratios, market cap, dividend yield, free cash flow, volatility, earnings growth, and debt-to-equity) form the dashboard of investing. None should be read in isolation, but together they give investors a clearer view of both opportunities and risks. Ignore them, and you may find yourself speeding blindly into danger or running out of fuel on an empty road. Pay attention, and you’ll not only navigate the market’s twists and turns more confidently, you’ll understand the mechanics under the hood that keep your investments moving forward.